CORNISH GLOBAL MIGRATION PROGRAMME
THE DIASPORA OF THE PEOPLE OF CORNWALL
Migration Decade
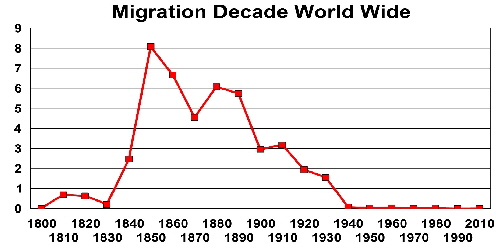
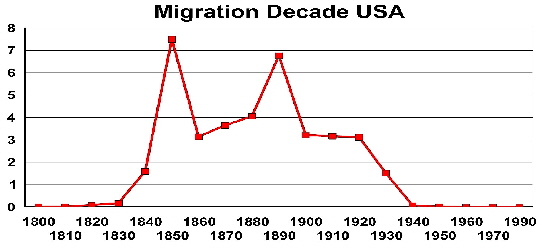
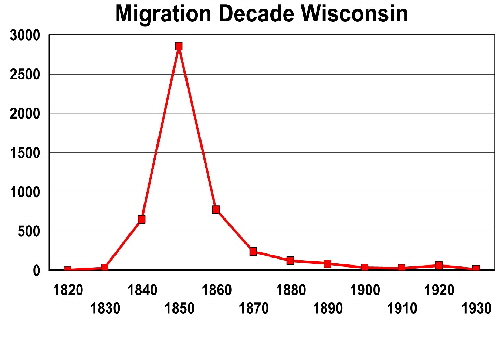
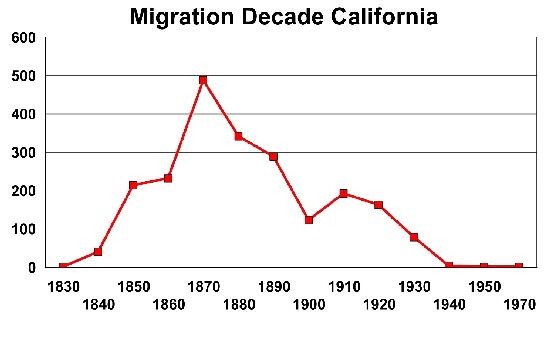
When we know the year of migration then we can produce a line chart which gives a picture of the ups and downs of the ‘rage for migration’. Below the first chart demonstrates the decades for 1800 to 2010 for all destinations. We can take this further by restricting the information to a particular region. The second chart illustrates the movement to the USA. In the third we have delved deeper and show a chart for Wisconsin and in contrast to this we show California. As usual, our statistics are only as valid as the quality of the information we have so far entered into the data base.


